Blog Two
02. Academic Conversation and Inquiry Process
01
Context & Gap
To summarize my previous blog post, I have been conducting a study to investigate the evolution of demographic accuracy of the rank_one algorithm. As 80% of the 84 agencies participating in the Colorado Information Sharing Consortium use Lumen facial recognition technology regularly, the Lumen rank_one algorithm has increasingly been implemented in our society (Arvada Police Department). Its biggest use is in Colorado law enforcement. However, this increased implementation has only lead to increased wrongful convictions. In October 2023, Randal Quran Reid, a black man, was wrongfully arrested and held in jail for a week because the officers of Jefferson Parish Sheriff's Office used facial recognition technology to identify Reid as a suspect for theft (Negussie).
However, there is little research done online regarding these algorithms, as the only similar studies have been conducted by the NIST, the National Institute of Standards and Technology. While the NIST does a thorough study on the rank_one algorithm and other FRS (facial recognition services), there are a few gaps that I am addressing. For starters, their research does not look into how the false match rate changes in regard to the demographics of the individual. It also does not look into how the accuracy of these programs increases per version also in regard to the demographics.
02
Process, Progress, & Roadblocks
The intended goal of my project is to analyze the improvement of the FMR (false match rate): the rate at which the algorithm falsely identifies one person of a certain age, sex, and race to another person of a certain age, sex, and race. By holding two of the demographics constant, I will be recording the value of the FMR in each version to analyze how each demographic affects the accuracy. For example, I would record the False Match Rate between a 12-20 year-old Female from Ghana and a 12-20 year-old Male from Ghana (keeping age and race constant). An entire database of these values was generated in Part 3 of the Facial Recognition Vendor Tests (Grother) conducted by NIST - over 44,000 values represented in colors and translated through a color scale. Once I find all of my values, I will be able to compare the trend of the overall accuracies with respect to demographics, which will be analyzed through a set of equations attained from Part 8 of the Facial Recognition Vendor Tests (Duewer:)
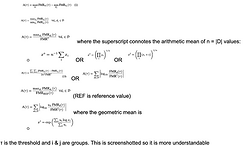
Initially, I had planned on recording the value of the FMR for each race, sex, and age group for all 7 versions. In order to do this, I had to create a scale that matched the color to a numerical value.


As seen in the figures, I translated the colors into numerical values using the scale the NIST provided (blue is -6 and means the False Match Rate is very small, while red is 0 and means the FMR is very high). A numerical value of -3.95 (attained from comparing a 35-50 year old Russian female to a 50-65 year old Russian female) meant that the FMR was 10^-3.95 (0.00011): roughly 1 in 9000 instances of the rank_one program comparing the 35-50 year old Russian female and a 50-65 year old Russian female are inaccurate). As seen in the figures, I kept two demographics constant (the age and gender) and varied age groups. This is why I didn't record the diagonal line, when all 3 demographics were constant. After initial data collection, I narrowed down my data collection to 7 countries instead of all 22 in order to fit the time constraint - 1 per demographic group the NIST defined. Using a random number generator, I selected Russia, Nicaragua, Ghana, Jamaica, Kenya, India, and Thailand.
I had a few roadblocks but the biggest was changing my methodology. Initially, I was going to record all 22 countries and their data, which would have resulted in more than 20,000 per all 7 versions. However, after a few weeks progressed I came to realize that my initial goal was not possible in the time I was given, as translating a square takes about a minute and there was a lot to do. Therefore, I decided to narrow it down to only the odd versions and 1 country per demographic group.
03
Results, Discussion, & Conclusion
I separated my data into 4 columns:
-
same race and gender - varying age
-
same age + race - varying gender
-
same age + female - varying race
-
same age + male - varying race
Here is a sample of each category:
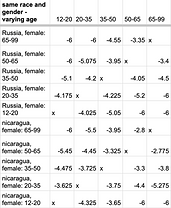
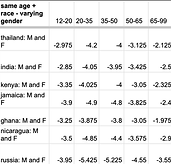
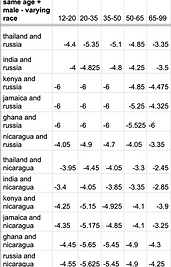
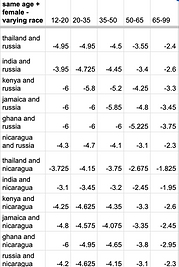
As I have been collecting data, there are a few trends that I noticed. For starters, men are less likely to be falsely matched than women. This can be seen by comparing the third and fourth table, as they are virtually the same except that the third table compares men with each other and the fourth table compares women with each other. Consequently, there are higher values in the fourth table. The data is measured on a logarithmic scale, meaning that the FMR = 10^(value). Similarly, people of color also tend to have a higher FMR (higher value) compared to white people. Lastly, I noticed that older and younger people tend to have a higher FMR than people in their middle age. A further breakdown regarding my data analysis will be discussed once I put the data into the equations.
These results show that there is still demographic bias in facial recognition programs. While the accuracy is overall improving between each version, there is still work to be done to make this an acceptable tool for law enforcement. One limitation I had was that it was hard to be precise with the translation, so I struggled to make it as accurate as I could. Overall, I think I have an error interval of ±0.05. However, since my human error is not that big, it should not have a significant impact on my data.
Improving the accuracy of facial recognition technology should be a big priority in today's world. With the growing use of artificial intelligence, facial recognition services are used not only in law enforcement, but also in unlocking phones, border control. finding missing people, and more. However, if we are to expand the utilization of facial recognition in our modern world, we need to actively ensure that these services are fair and accurate for everyone.
More Information
Negussie, Tesfaye. “Lawsuit: Man Claims He Was Improperly Arrested Because of Misuse of Facial Recognition Technology.” ABC News, 8 Oct. 2023, abcnews.go.com/US/lawsuit-man-claims-falsely-arrested-misuse-facial-recognition/story?id=103687845.
Grother, Patrick, et al. Face Recognition Vendor Test Part 3: National Institute of Standards and Technology, Dec. 2019. Crossref, doi:10.6028/nist.ir.8280.
Duewer, David L. Face Recognition Vendor Test (FRVT) Part 8: National Institute of Standards and Technology, 2022. Crossref, doi:10.6028/nist.ir.8429.
Arvada Police Department. Arvada Police Department Facial Recognition Accountability Report LexisNexis Lumen Facial Recognition Service. 2023, www.arvadaco.gov/DocumentCenter/View/2256/FRS-Accountability-Report?bidId=.